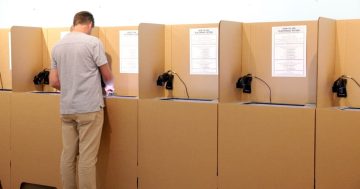
Last week, there was a media release over on Elections ACT, announcing that the final electoral returns for the 2008 ACT Elections were finalised and available.
Fairly boring in and of itself, but sometimes the donors want to know where their went.
So the breakdown looks like this:
Parties (both major and minor) spent $2,359,324.12 in declared expenditure, 95% of total expenditure, for 96.7% of the vote.
Ungrouped candidates spent $124,893.01, 5% of expenditure, for 3.3% of the vote.
All parties and candidates spent $2,484,217.13 in declared expenditure.
This was an average declared spend of $67,141.00 for each day of the campaign.
Of the three ACT Major parties:
Together they make up $2,183,691.39, being 87.9% of the total financial expenditure[1] on the Election.
Together they received 84.6% of the first preference votes.
ACT Labor’s campaign made up 56.1% of the expenditure, spending $1,392,643.00 in total[1] ($37,639/day), for 37.4% of first preference votes, and a final cost per vote at $17.60.
ACT Labor can also claim the highest cost-per-candidate of any campaign, with an average of $81,920.18.
The Canberra Liberals’ campaign represents 29.3% of total expenditure, spending $727,766 in total[1] ($19,670/day), for 31.6% of first preference votes, and a final cost per vote of $10.89.
The Greens’ campaign made up only 2.5% of expenditure, spending $63,281.62 in total[1] ($1,710/day), for 15.6% of first preference votes, and a final cost per vote of $1.91.
On the minor parties:
The Australian Motorists’ Party made up 3.0% of expenditure, spending $75,234.51 in total[1] ($2034/day), for 5.0% of first preference votes, and a final cost per vote of $7.13;
Community Alliance Party made up only 0.7% of expenditure, spending $16,807.54 in total[1] ($454/day), for 3.7% of the first preference vote, and a final cost per vote of $2.17.
Pangallo Independents made up 1.1% of expenditure, spending $25,059.38 in total[1] ($677/day), for 2.0% of first preference votes, and a final cost per vote of $5.89.
The Liberal Democratic Party’s campaign made up 0.1% of expenditure, spending $2,076 in total[1] ($56.11/day), for 0.4% of first preference votes, and a final cost per vote of $2.68.
Richard Mulcahy’s Canberra Party’s campaign on the other hand, seems by the numbers to be some tremendous paradigm of party inefficiency.
With 2.4% of expenditure, spending $56,455.30 in total [1] ($1,526/day), achieved only 1.1% of first preference votes, at a final cost cost of $24.12/vote.
Highlights of the Ungrouped Candidates:
The campaign to elect Helen Cross cost $67,300.00 in total[1], more than the entirety of the Greens’ (which got four Members elected to the Assembly) while at 0.5% first preference, achieved 15.1% less first preference vote than the Greens, and at the princely cost of $60.09/vote.
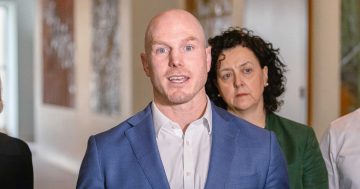
Mark Parton’s campaign was the third most expensive on a per-candidate basis (behind Helen Cross), with $48,779.00 spent for 1.8% of the first preference.
Adam Verwey’s entire declared campaign expenditure seems to have been $40, meaning each of his 170 votes cost only $0.24.
This was the second lowest cost-per-vote of any candidate, with Harold Hird receiving 712 votes through no expenditure in any category.
Way to go, Harold.
[1]: Totals are of disclosed expenditure, which is only required in categories of Broadcast Media, Published Advertising, Theatrical\Entertainment Spending, Authorised Printed Matter, Addressed Printed Matter, Consultancy Fees, and Polling\Research.
(Costs of operating a campaign such as office rental, telephones, travel, etc are not required to be disclosed)
[ED – numbers now revised]