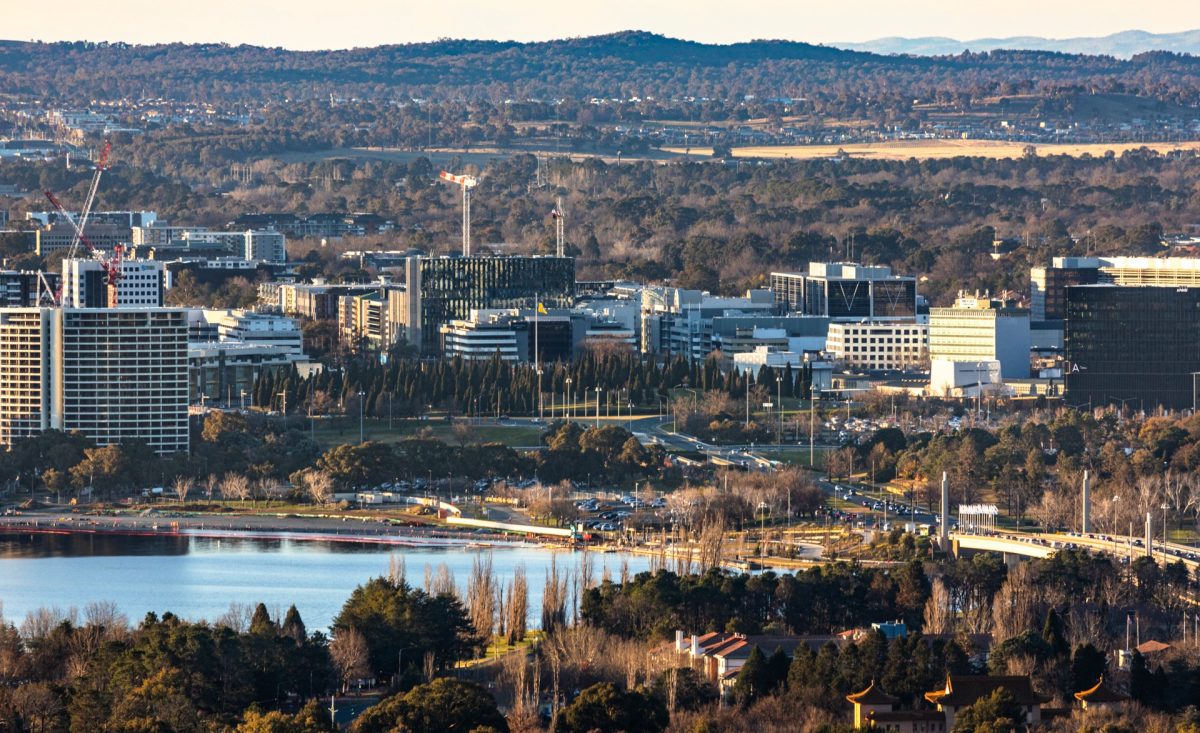
The public housing salt-and-pepper policy significantly impacts average and median incomes. Photo: Michelle Kroll.
New Australian Taxation Office data has revealed Canberra’s richest and poorest suburbs – but the list changed depending on whether you examined median or average income.
While the stats didn’t change for the top five suburbs with the highest incomes, it was a different story regarding suburbs with lower-income households.
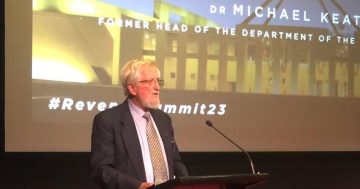
ANU economic geography researcher Dr Francis Markham said that was because the average (or mean) income data point was more sensitive to extremes.
“With the median income, it means half the households [in that area] will have an income below that point, and half will have an income above that point,” he said.
“But say Bill Gates moves into Bonner, that would skew the mean.”
Postcodes 2603, 2600, 2604 and 2605 were the top four richest suburbs, whether you took the average or median income. Crace and Mitchell (2911) came in fifth when considering median income.
Forrest, Griffith, Manuka and Red Hill came out on top under postcode 2603, which had a median income of $81,877 and an average income of $126,534.
The difference between the two numbers could be attributed to the Territory’s public housing policy.
“We have a ‘salt and peppering’ approach to public housing in Canberra,” Dr Markham said.
“So at a postcode scale, you don’t necessarily see much concentrations of poverty.”
Despite public housing being more established in older suburbs, the data could still be skewed to reflect a much more affluent reality.
“The higher net worth families do tend to cluster in those wealthier suburbs to such a degree that the average income is lifted, despite significant public housing in those suburbs,” Dr Markham said.
“Another amusing curiosity for me is, when you look at these maps [of Canberra], you see a correlation between the hills and higher incomes.
“As you head up the hills of Tuggeranong, Weston Creek and other areas, you see those on higher incomes tend to be higher up the hills enjoying the views.”
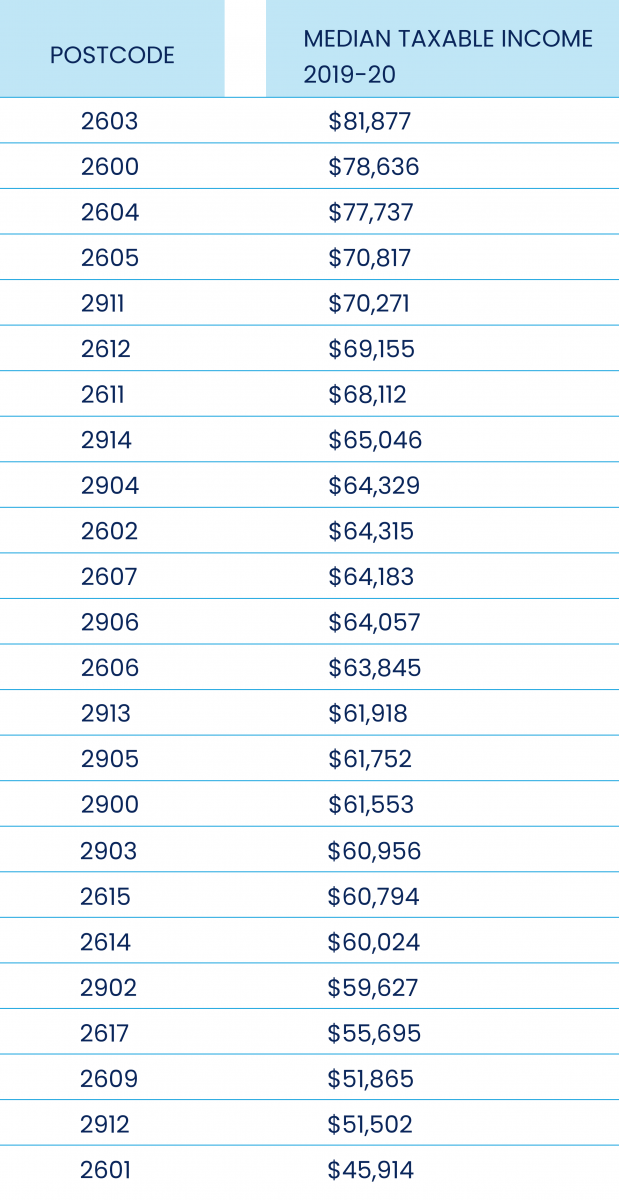
Median income table 2019-20. Source ATO.
Canberra’s newer suburbs were making their way up the list, with Crace and Mitchell (2911) fifth on the list with a median income of $70,217.
Dr Markham explained their newness had an influence on the statistics.
“There are some interesting puzzles in some newer suburbs, particularly in Gungahlin and Molonglo Valley,” he said.
“The relative affluence of these suburbs indicates the ‘entrance requirements’ for these areas.
“They’re generally working families or of working age, there are fewer retirees in these suburbs, and there’s a lag in public housing estates in these suburbs.”
At the other end of the scale, the suburbs with the lowest median incomes were 2601, 2912, 2609, 2617 and 2902 respectively.
Dr Markham said this tended to correlate with where university students were living.
“[Take 2601], that reflects the high student population in that area, so it’s not necessarily a great indicator of poverty as such,” he said.
“It’s more a life course question – you expect many of them to graduate and then go on to get higher paying positions.”
Postcode 2601 covered the Acton, Black Mountain, Canberra and City areas, with a median income of $45,914.
Postcode 2912 was assigned to PO Boxes for government and larger companies, but 2609 covered Fyshwick, Symonston and Pialligo, which had a median income of $51,865.
“The reason somewhere like Fyshwick comes up would have more to do with the caravan parks in Symonston,” Dr Markham said.
“While potentially for somewhere like Evatt [2617], you wouldn’t necessarily call that an area of concentrated poverty, but more of a lower income suburb.”
Dr Markham said one anomaly for Canberra was that income data did not correlate with higher education completion levels as you would see in other areas.
“You’d say the inner north and inner south suburbs have higher levels of higher education completion compared to somewhere like Tuggeranong, but if you looked at the average income, you wouldn’t say that’s the case,” he said.
“That’s because somewhere like Tuggeranong has a different occupational profile, but it’s not an area characterised by lower scale incomes.”
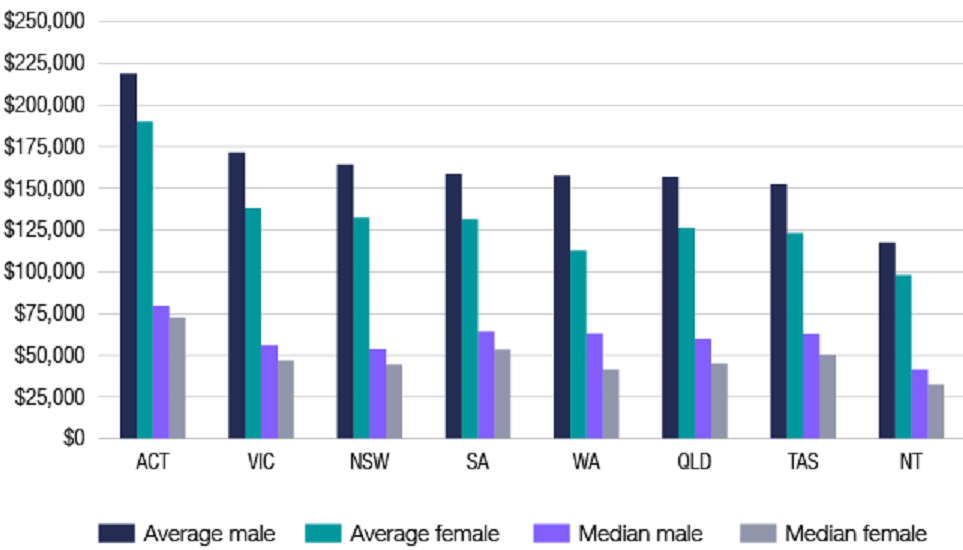
Super balance by state/territory and sex, 2019/20 financial years. Photo: ATO.
The data also revealed Canberrans had the highest super balances when compared to other states and territories.
The average Canberra man had $217,473 in super, while the average woman had $190,251.
The median super balance was $79,680 for men and $72,900 for women.