Car thefts in the ACT: Is your car safe?
According to statistics recently released by the National Motor Vehicle Theft Reduction Council (yes there is such a thing, I didn’t make it up), Canberra motor vehicle thefts are up 95 per cent on 2013 figures, and 41 per cent higher in 2017 compared to 2016.
The actual figures were a total of 1,321 vehicles stolen in 2017; 939 in 2016; 968 in 2015; 757 in 2014 and 678 in 2013.
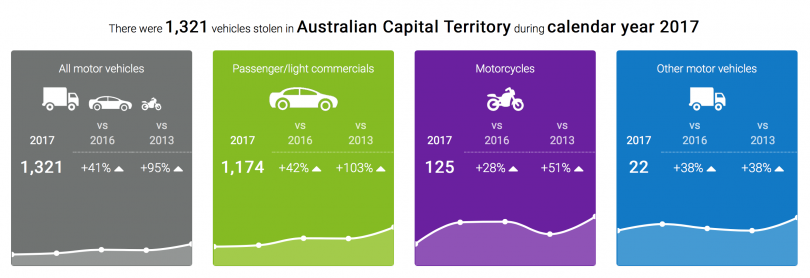
National Motor Vehicle Theft Reduction Council statistics for motor vehicle theft in the ACT for 2017 shows a 41 per cent increase on 2016 and a 95 per cent increase on 2013. Image: National Motor Vehicle Theft Reduction Council.
The report showed the vehicle of choice for car thieves in 2017 was … drum roll … 68 N15 Nissan Pulsars that were between 17 – 22 years old …
This was followed by the following stellar choices:
- 19 BA Ford Falcons 12 to 15 years old;
- 15 N14 Nissan Pulsars 17 to 22 years old;
- 15 VE Holden Commodores 4 to 11 years old; and
- 14 TS Holden Astras 12 to 18 years old.
My powers of deduction do not detect the work of a ‘grand theft auto’ style criminal mastermind scheme taking place here in the ACT.
This is borne out by the report stating that 684, or 58 per cent, of the stolen vehicles were valued at less than $5,000 dollars, with an average value of $2,163.
There was also a 26.5 per cent increase in thefts of motorcycles from 2016 to 2017. In real numbers, the increase was from 98 to 124.
Only 24 of the 1,174 stolen vehicles, or two per cent, had a value greater than $50,000. Mind you, they averaged $71,221 each – so maybe some ‘grand theft auto’ going on here.
So where are you most likely to get your ‘Nissan Pulsar’ stolen in the ACT? Well, the good folks at the National Motor Vehicle Theft Reduction Council don’t provide that information on their website. So over to the ACT Policing site to see where our ‘happy’ car jackers are targeting (I would imagine not far from home, as you know they are stealing a car …).
Interestingly, ACT Policing Crime Statistics say that there were 1,572 stolen vehicles in Canberra between 1 January 2017 and 31 December 2017.
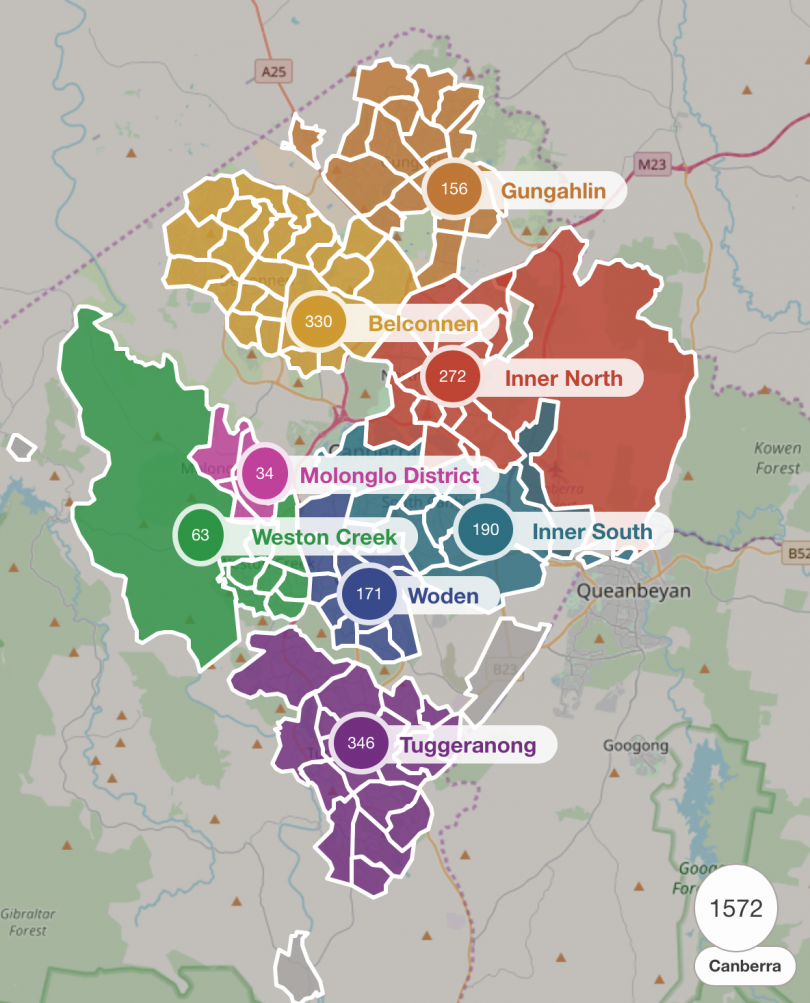
ACT Policing Crime Statistics for Stolen Vehicles in the ACT for 2017. Image: ACT Policing.
Tuggeranong had the largest proportion of stolen vehicles, 346 or 22 per cent, closely followed by Belconnen with 330 or 21 per cent and then the inner north with 272 or 17.5 per cent.
According to ACT Policing statistics, Kambah topped the list with 69 stolen vehicles, Wanniassa and the City came in equal second with 42, and Gungahlin Town Centre came in third with 40.
But back to the National Motor Vehicle Theft Reduction Council report.
The report statistics showed 82.6 per cent or 1091 of the 1321 cars stolen in the ACT in 2017 were recovered.
Stolen motorbikes, on the other hand, don’t fare so well. Only 46 per cent, or 58 from a total of 125 thefts in the ACT in 2017, were recovered. But that is a story for another day …
So, what are we to take from this report? Basically, where you live, where you park, the value of your vehicle and its year of manufacture are a large determinant of the risk of having your car stolen in the ACT.
The worst possible scenario would be living or parking your 17 – 22-year-old Nissan Pulsar in Kambah. Be warned.
Do you feel safe leaving your car parked out the front of your home or at your place of work?