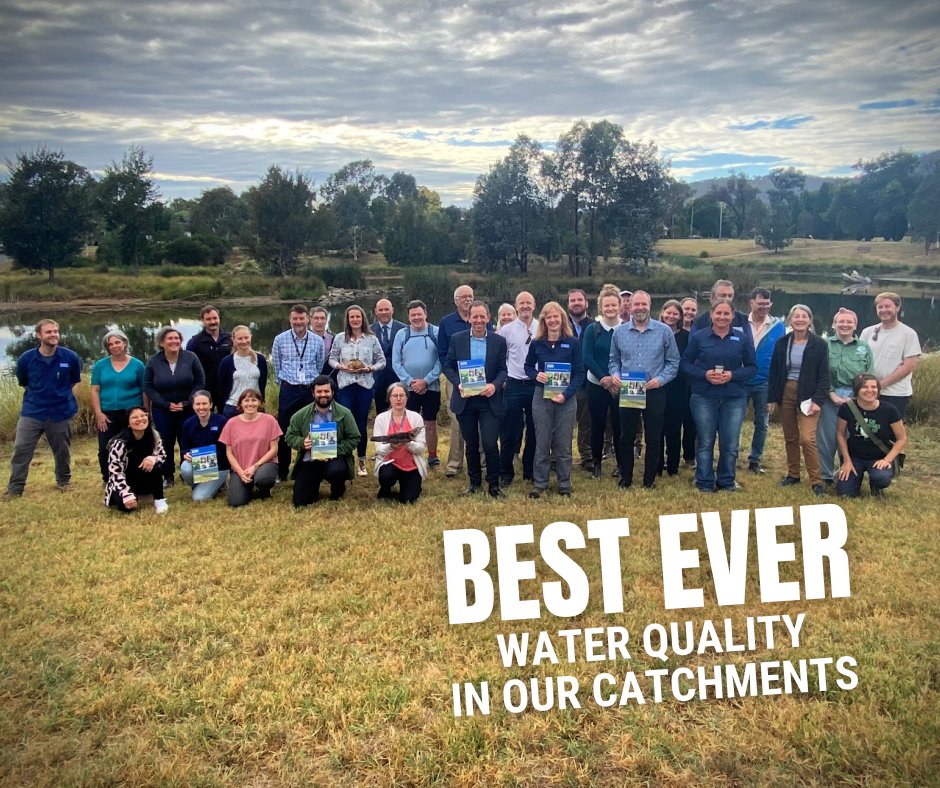
The region’s water has received a good grade in a recent report. Image: Shane Rattenbury MLA/Twitter.
The capital region’s water supply has never been better, according to the latest Catchment Health Indicator Program (CHIP) report, released by Upper Murrumbidgee Waterwatch this week.
A majority of reaches (54 per cent) were deemed either ‘excellent’ or ‘good’, making it the best outcome since the CHIP began nine years ago.
Overall, eight reaches were rated ‘excellent’, 44 were rated ‘good’ or ‘fair’, and only one was rated ‘poor’ by the report.
None were given a ‘degraded’ rating.
The CHIP report drew from 2000 surveys from more than 200 volunteers at 237 sites in the Cooma, Ginninderra, Molonglo, Southern ACT and Yass sub-catchments.
Minister for Water, Energy and Emissions Reduction Shane Rattenbury said the report covers one of the wettest years in recent times.
“Thanks to La Niña conditions for a third consecutive year, heavy rainfall on the already saturated landscape produced constant runoff and high water flows throughout 2022.”
No sites surveyed were considered ‘dry’ – where a volunteer went to sample it, but it had dried up – but several were too wet for volunteers to access them, according to the report.
“Although the heavy rain and continuous, high flowing water has resulted in our highest water quality scores in recent memory, this has contributed to an increase in streambank erosion across the ACT region, with soil and other materials washed off the bank and swept away downstream,” Mr Rattenbury said.
“This was especially the case in urban and rural areas with low numbers or diversity of native vegetation, both in-stream and along the riverbanks.
“This highlights the importance of restoring our urban and rural waterways to protect waterway health, restore biodiversity and make waterways more resilient to extreme weather conditions.”
While the overall scores suggest good health, there was less of an improvement than found in the 2021 CHIP report.
“2021 saw a marked improvement in catchment condition compared to the dramatic impacts of the fires and drought in the preceding years,” according to the latest report.
“While overall condition improved again in 2022, it was less pronounced and not as uniformly felt across all waterways.”
The CHIP report also put together a snapshot of platypus health in the region.
“Results from the annual Platypus Month surveys were also highlighted in the report, with 21 individual platypus sighted over August 2022,” Mr Rattenbury said.
“This is 10 less than were recorded during the same period in 2020 and is likely a consequence of high flows disrupting platypus feeding behaviour.”
Additionally, no platypus were found at Jerrabomberra Creek for the first time since Upper Murrumbidgee Waterwatch’s regular monitoring began in Platypus Month 2014.
To prepare the CHIP report, volunteers and coordinators visit the sample sites and collect data concerning water quality, waterbugs and riverbank vegetation.
That data is analysed to produce a score for that site, and are combined to suggest the overall health of an individual stretch of a waterway, called a reach.
Mr Rattenbury said the report gives a bird’s-eye view of water quality throughout the region.
“To have more than 2000 pieces of data from more than 200 volunteers come together in this report really gives us a fantastic understanding of where the catchment’s at.
“Over quite a sustained period of time now, this report has been building up a series of data that helps us better understand our local waterways,” he said.
“[It helps us to] understand the health of them, to see where things are getting better or worse, as the case may be, and to really be an excellent example of citizen science coming together in a fantastic way with government investment and government understanding of our landscape.”
The 2022 CHIP report can be accessed online on Upper Murrumbidgee Waterwatch’s website.


