
After discussing the reasons why property prices continue to grow and what the likelihood of further growth is, let’s address the biggest question – when is the best time to buy or sell to maximise profits?
The first article in this series provided evidence as to why property prices in Australia, and specifically Canberra, had the capacity to grow so strongly in the past and that there is still plenty of potential for prices to go even higher in the future.
The second article presented evidence that although current conditions are positive, they are less than optimal for further uninterrupted growth in prices.
This final instalment deals with the optimal timing for buying and selling decisions. We will also discuss where we are at in the current property cycle.
Property is an investment regardless of whether you buy to live in it or let it out. As with any investment decision, there are better and not-so-great times to buy and sell. When investing, a general idea is to “buy low and sell high” but it is actually much more difficult to stick to this rule than it sounds.
In a nutshell, you need a proper gauge to assess what is ‘high’ and what is ‘low’ – something that can be trusted to generate the right signal and aid in the decision – since the range of factors influencing price movement can be quite complex, as hinted by the content of the second article.
There are many different approaches to deal with the information overload issue. The “Property Clock” is probably the most readily recognisable concept but, since it is based on subjective expert opinions, it suffers from a severe bias.
My favourite indicator is The Buy-Rent Indicator (BRI) which tracks relative changes in the costs of buying and renting.
The logic behind this indicator is that the optimal choice for an accommodation option (i.e. whether to buy or rent) is determined based on which cost is declining in relation to the other.
Please note, it is not which option is cheaper in absolute terms but just which one of the two options has slower growing costs, and hence which one is more attractive in the short term. The cost of buying tends to be higher than the cost of renting for a variety of reasons – this is something to discuss on another occasion.
The relationship between changes in the cost of renting and buying are very similar in Canberra and on a national level so I will discuss only the local perspective.
The indicator is currently in the Rent Zone but has been hovering up and down around the neutral position since September 2014.
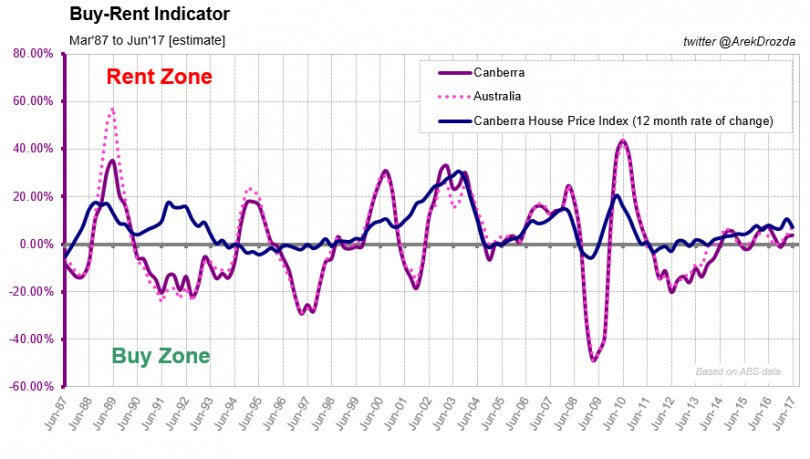
The Buy-Rent Indicator (BRI) Canberra.
The interpretation of this indicator is not straightforward so please bear with me while I explain the concepts.
The optimal time to buy is when the indicator is at its lowest in a given cycle and the best selling opportunities are when the indicator is at its peak.
Since ultimate peaks and troughs can only be determined “after the fact”, for all practical reasons, any move of the indicator close to or above 20% / below -20% level should be treated as if the indicator is approaching a potential turning point, and hence, is marking the optimal time for a purchase or a sale.
For example, in the current cycle, BRI reached its lowest point in June 2012. Since then, house prices in Canberra have increased around 26%.
The last significant opportunity to sell was in June 2010 and subsequently, prices had declined by 2% over a two year period to June 2012. This pattern can be observed consistently over the last 30 years.
As a side note, any property price movement of up to +/- 5% should be considered a “margin of error” for all property price tracking statistics. So that 2% fall was not statistically significant.
However, this example illustrates that the optimal point to sell was when the market was still quite buoyant, rather than waiting to sell after the malaise crept into it. For extra perspective, please examine the above chart with references to indicators presented in the previous two articles in this series.
The current situation is less clearly defined, which reflects the overall uncertainty about the near-term direction of property prices (as discussed in the previous article).
BRI in the Rent Zone indicates that the opportunities for a well-timed purchase in the current property cycle have ended. However, the indicator is still nowhere near its historical peak levels. In this respect, the current cycle is rather unusual comparing to those in the past 30 years.
In particular, historical cycles were as short as 2 years in duration but never exceeded ~6 years. It has been seven years since the last significant peak in the BRI and five years since the last trough, but it is not possible to clearly distinguish as yet a new high nor a new low which would mark the end of the previous cycle and the beginning of the new one.
There is a possibility that there will not be a decisive “sell” signal in this cycle (similarly as there was no clear ‘buy’ signal in 2004). This would mean a new low has to form soon around the -20% level to validate 2016 as the previous peak of the cycle.
The uncertainty about the future direction of prices may not be a big issue for property upgraders, since they are swapping one property for another, but the situation poses quite a dilemma for the first time buyers, property investors or those who are contemplating cashing out and exiting the Canberra property market for good. What do they do?
I cannot provide financial advice and circumstances will differ from one individual to another but there are some general rules that apply to all investment decisions. In particular, it all boils down to individual risk appetite and the ability to sustain losses.
Timing the market is never without risks so, if you can’t afford to make a mistake and lose any cash but have to make a decision soon, it is best to stay clear and not to buy in this market or exit it at the first available opportunity. This way you will not risk any of your hard earned money or you can lock-in the real profits you have made on your property to date.
For those who can accept an elevated level of risk, we know from previous articles that probabilities favour further price growth after a likely slow down. This situation offers the opportunity for additional profits (i.e. by buying early into a rising market or holding off with the sale for a better price at a later date). However, it is also well known that it is impossible to eliminate from the equation the effect some dramatic and unforeseen events may have on the market so there are never any guarantees.
All in all, this is not the optimal time in the property cycle to get into, add to or divest from your property portfolio. Ideally, one should always pick a reliable gauge, monitor it periodically and plan decisions in advance to be ready to act only “when the time is right”. But it takes lots of patience to execute this strategy successfully.
In this series of articles I challenged some common perceptions about the property market in Australia, but not without reason. A series of statistical indicators included in the articles provide good evidence in support of my side of the story. I recommend studying them in detail for your advantage.
Overall, the conditions are favourable for further price growth and the conclusions from my original 2014 analysis remain unchanged. That is, in the decade to 2023, Australian property prices can be expected to grow by 60%+ under the most probable mid-range growth scenario (and this scenario is currently in play).
If you take away with you just one message it should be that the factors driving property prices in Australia are complex and go beyond the simplistic arguments generalised for easy consumption by the media. Don’t accept ‘expert opinions’ on face value. Seek facts and supporting evidence, and explore alternative sides of the argument for better understanding.
Did you find the information useful and educational? Did it change your perspective on the property market? Would you like to hear more about property and property investment related topics on RiotACT?


