
Canberra is renowned for its North/South divide and the stereotypes that go with it. The north side is categorically a hotbed for crime whereas the south is home to Canberra’s upper class. But do the stereotypes really fit the book? ACT Policing have introduced an interactive map on their website that shows the crime related statistics for the districts of Canberra for the 1st quarter of 2012. This ranges from traffic infringements (with over 3500 notices across Canberra) to homicide.
At first glance the inner south of Canberra seems to be just as bad as every other district, making up about 13% of the totalled crime for the capital. However, upon further inspection of certain areas of crime, the richer suburbs of Canberra no longer seem so pious. South Canberra makes up an astonishing 34.8% of the recorded sexual assault claims in the ACT.
Initially RiotACT HQ held a closer proximity to Queanbeyan responsible for the figures. One thing that the map allows you to do is scroll in and see the number of infringements, assaults etc. that particular suburbs had. This tool allows you to see that all counts of sexual assault in the inner south happened in Narrabundah.
Has anyone got any theories to explain these strange statistics?
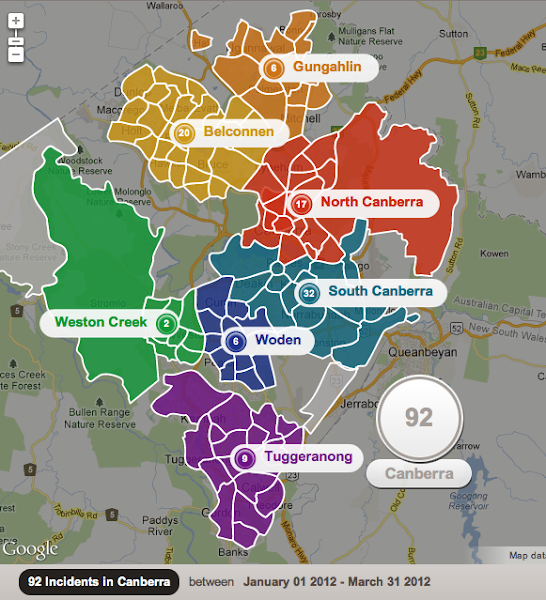
[ED – We’ve asked the ACT Policing Media Unit for comment on this alarming statistical blip and will share it when we get it]
UPDATE 26/06/12 09:28: This in from the media unit:
The increase in the number of reported sexual assaults in the inner south relate to one historic sexual assault incident reported to police during the Jan-Mar reporting period. The crime maps are based on when the crime is reported to police.
Without going into details, that one report had 32 offences recorded against it.


