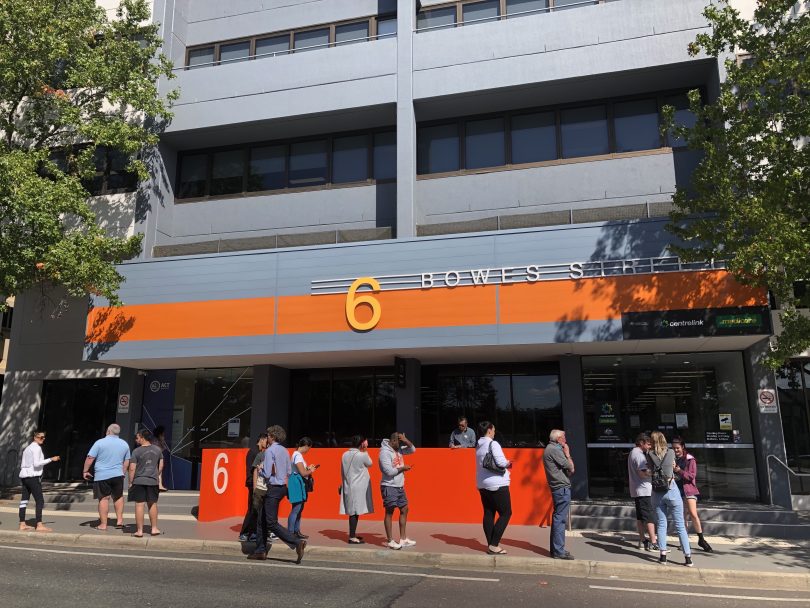
Scenes like this in March 2020 created extra demand for government services last year. Photo: File.
The Federal Government injected thousands of jobs into the Australian Public Service in the first half of 2020 to deal with the public health crisis and economic wreckage caused by the pandemic, but by year’s end it was weaning itself off the extra staff.
The latest report on APS employee numbers from the Australian Public Service Commission shows that in the first six months of 2020, there was an increase of 5926 (4.1 per cent) staff, mainly in non-ongoing or temporary roles (3547), but from 30 June 2020 to 31 December 2020 the number had dropped by 1738 (1.2 per cent).
All up there were 148,736 employees at the end of last year – an increase of 4188 (2.9 per cent) from the same time in 2019, but still 11.1 per cent from the peak of 167,339 in June 2012.
A little more than 38 per cent of them – 56,852 – were based in Canberra.
The year produced a rise in the number of non-ongoing employees including casuals which now make up more than half of these workers.
The APSC says the proportion of casuals as part of the whole APS workforce has risen since 2006 and at 31 December 2020 was 5.9 per cent – up from 5.3 per cent in December 2019.
Agencies that employed a high number of casuals at 31 December 2020 were Services Australia (2953, 33.9 per cent), the Australian Taxation Office (2693, 30.9 per cent), the Australian Electoral Commission (731, 8.4 per cent) and the Department of Agriculture, Water and the Environment (426, 4.9 per cent). Almost all casual employees (96.8 per cent) are engaged at the APS 1–4 classifications.
The number of ongoing employees increased by 1721 since 31 December 2019 and make up 88.4 per cent of the APS workforce and down from 89.7 per cent in 2019 – a figure that has changed little over the last 20 years hovering around 90 per cent.
As a single department, the Australian Taxation Office had the biggest increase in staff in 2020 with a total jump of 2378, including 704 ongoing and 1674 temporary employees.
Services Australia, which includes Centrelink, experienced an overall increase of 471 staff driven by an increase of 1228 temporary employees.
It was also boosted by transfers from other agencies totalling 30,209 which made up of the bulk of the Machinery of Government changes during the year.
The largest decreases in 2020 were the Australian Electoral Commission at 413, including the loss of 32 ongoing and 381 temporary employees, and the Department of Agriculture, Water and the Environment at 347 including 37 ongoing and 310 temporary employees.
Four agencies accounted for more than half (55.8 per cent) of the APS workforce – Services Australia (20.7 per cent), the Australian Taxation Office (14.0 per cent), the Department of Defence (11.6 per cent) and the Department of Home Affairs (9.5 per cent).
The APS is also ageing with the average age of APS staff increasing steadily from 40.1 years in 2001 to be 43.6 years at 31 December 2020,
The proportion of the APS population that are 50 years or older has increased from 20.5 per cent in 2001 to 33.1 per cent in 2020, and at 31 December 2020, there were 8.4 per cent of APS employees aged 60 years and above.
The proportion of staff aged over 55 has almost tripled from 7.3 per cent in 2001 to 19.5 per cent in 2020.
In 2001, a higher proportion of employees were aged under 50 compared to 2020, and the number of staff under the age of 30 has fallen from 18 per cent in 2001 to 12.8 per cent in 2020.
The APS is increasingly top heavy with the number of higher classifications rising steadily.
The most common classification across the APS was APS 6, increasing from 18.1 per cent in 2001 to 23 per cent in 2020, and for the first time APS 4 classifications (18 per cent) fell behind the EL 1 classification (18.5 per cent) .
Twenty years ago APS 4 was the most common classification.