By Ian Winter, Australian Housing and Urban Research Institute
The historically low interest rates being enjoyed by Australian households are fuelling talk of a housing bubble, despite efforts by the Reserve Bank of Australia to hose down what it calls “unrealistic alarmism” around these dangers.
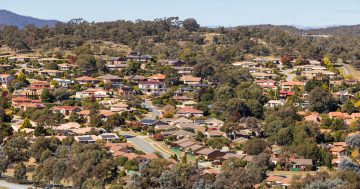
Many of these hopeful buyers – particularly first home owners on low to moderate incomes – will look to outer suburbs of our cities. But just how well will they do in accumulating long-term wealth through their housing choices?
Previous generations of lower-moderate income home buyers did acquire wealth from their homes. AHURI research using Melbourne as a model reveals that lower to moderate income home owners (defined as households in the lowest 40th percentile of income, around $35,000) who bought in 1981 accumulated wealth with an average annual real rate of house price increase of 4.4%.
However, the biggest cause of increased wealth has been the restructuring of the housing market with increasing demand for inner and middle ring suburbs generating higher prices, a process observed in all Australian capital cities.
Once relatively egalitarian across Australian cities, our property markets have become polarised. The most affordable homes for lower-moderate income home buyers are now confined to the outer suburbs and will only increase in value at slower rates compared to housing in the more expensive inner and middle suburbs — effectively trapping poorer households on the edges of our cities.

The increased change in demand for inner and middle suburbs can be seen in a bid rent curve, which shows the variations in property prices and rents as one moves further away from the Central Business District (CBD).
Places where rents or prices are greatest reflect the most desirable locations, often being closest to the CBD (where amenity and employment opportunities are better and transport costs lower), and decline the greater the distance from the CBD.

Comparing the bid rent curves for five Melbourne corridors (western, northern, eastern, south-eastern and southern) showed that in 1981 the price curve was flat in all five corridors, with little difference in price as distance from the CBD increased. By 2008 that had changed, with all five corridors showing much higher prices in inner and middle ring suburbs and much lower out towards the fringe.

In addition, house prices in 2008 were much higher at any point on the five curves compared to 1981, showing that lower-moderate income home buyers built housing wealth no matter where they bought so long as they stayed in their home for 25 years. Suburbs where properties were 10% cheaper than the Melbourne median house price in 1981 performed relatively well financially when compared to suburbs that were more expensive in 1981.

Six of the cheaper and eight of the more expensive suburbs studied in the research performed better than the median increase in value over the 1981–2006 time period. Of the six areas with the largest increases in wealth between 1981 and 2006, four were lower price areas in 1981, and of these, three had been industrial suburbs close to the CBD that had housed working class families.

For current and future lower-moderate income buyers the map of what is affordable is starkly different to that available to their peers in 1981. In 1981–82, 88% of Melbourne’s local areas offered reasonable choice for lower-moderate income purchasers; however, by 2007–08 only 8% of Melbourne’s local areas were affordable, and all of these were in outer urban or growth zones on the tail end of the bid rent curve: the Yarra Valley (eastern corridor growth zone), Casey (south-eastern corridor growth zone) and Melton (western corridor growth zone).
The research suggests that if lower-moderate income buyers purchase in these outer urban and growth zones they will build housing wealth over time, but at a much slower rate than buyers in more expensive suburbs. This slower rate of capital gains in the growth zones can be seen when comparing their resale prices with inner zone homes.

A startling 36% of growth zone homes sold four to five years after purchase were sold at a loss, while only 9% of inner zone homes were sold at a loss; after six to seven years, 8% of growth zone homes sold at a loss compared with 6% of inner, showing that capital gains growth had caught up with the transactions costs (such as stamp duty and agent fees) involved in buying and selling a property.
The lower rate of capital gain growth means lower-moderate income home buyers risk making a loss if they have to sell early for reasons not entirely of their choosing, such as interest rate increases, loss of job, loss of second income, a need to relocate for employment, or divorce. These households are also less likely to be able to afford to wait to sell until capital gains growth has negated transactions costs.
As home prices are rising faster in middle and inner zones than in outer and growth zones, it is increasingly difficult for lower-moderate income buyers to improve their housing wealth by trading up to middle and inner areas even if they have accumulated substantial equity in their homes. This has implications for households who need greater access to public transport, employment, health care and educational opportunities than are available in the outer and growth zones.
If house prices into the future are to be affordable for new buyers and yet grow for owners — at least at the rate of inflation so as to build housing wealth to buy into aged care housing — then policy should seek to “flatten” the bid rent curve.
Research shows a land tax, based on land value and universally applied, will most affect higher value land concentrated in the inner and middle suburbs, causing land prices to drop and therefore increasing housing affordability.
In addition, ensuring there is greater equity in amenity throughout all urban areas, rather than focusing public investment in inner city areas, will help increase the desirability and value of homes in the growth areas. The amenity of outer suburbs and growth zones can be increased through better physical infrastructure, particularly public transport, and strategic investment in child care, health care, and education centres.
Co-author Matthew Lovering is a writer/analyst at the Australian Housing and Urban Research Institute.
This article is based on an AHURI Evidence Review, which draws from a number of AHURI research projects.
This piece has been co-authored by Matthew Lovering, a writer/analyst at the Australian Housing and Urban Research Institute.
This article was originally published at The Conversation.
Read the original article.


