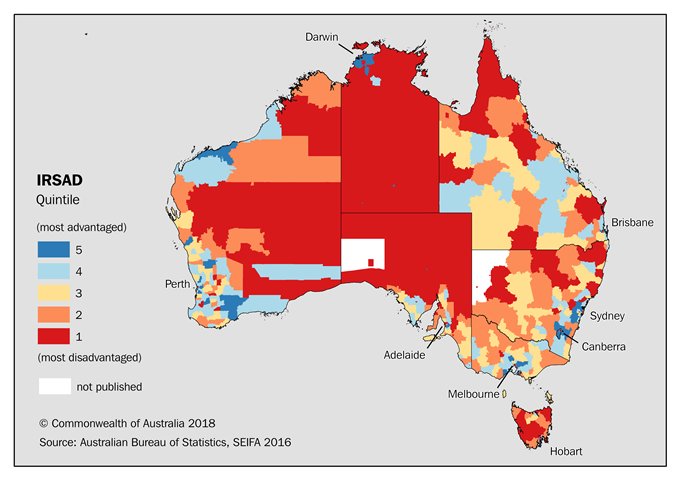
Index of relative advantage and disadvantage quintiles (20 per cent lots) for Local Government Areas. Image: ABS.
Handed the opportunity to write a story about Canberra’s ‘advantaged’ and ‘disadvantaged’ areas, based on recently released 2016 Census data from the Australian Bureau of Statistics, I grabbed at the opportunity, with great relish.
Eager to write a story about the massive disadvantage that is faced by swathes of Canberrans, cowering, starving in their ghettos, suffering outrageous discrimination and exploitation – I took a closer look at the statistics.
First things first, I thought, let’s have a look at the data. Probably should read the explanation of what an ABS ‘data cube’ is and what they contain …
‘The most important data cube is the Indexes data cube for the SA1 level indexes – all the SEIFA 2016 data cubes are derived from the SA1 level indexes. The SA1 level data cube contains the index scores for each of the four indexes, as well as the associated ranks, deciles and percentiles at the Australia and State/Territory level …’
Clear as mud. Getting that out of the way, I thought it best to get my head around SEIFA (Social Economic Indexes for Areas) and what each of the indexes relate to.
You will be fascinated to know that the four indexes of SEIFA ‘capture a slightly different concept of social-economic advantage and disadvantage’.
These are, according to the ABS:
- The Index of Relative Disadvantage – identifies and ranks areas in terms of their relative socio-economic disadvantage;
- The Index of Relative Advantage and Disadvantage – measures both advantage and disadvantage;
- The Index of Education and Occupation and the Index of Economic Resources – both measure particular aspects of socio-economic advantage and disadvantage.
Well, that certainly clarifies – absolutely nothing! But if you are fascinated by this stuff you can read all about it in greater detail in the ABS Technical Paper Socio-Economic Indexes for Areas (SEIFA) 2016 2033.0.55.001.
Also, if you are interested in the statistics that have been included to come up with this index, they can be found here in the Relative Socio-economic Advantage and Disadvantage (IRSAD) variables.
This is the long way round to saying that these statistics show that of the 108 ACT suburbs in the ABS statistics for Relative Socio-economic Advantage and Disadvantage:
- 68 (or 63 per cent) are in the top 90 – 100 per cent of most advantaged Australian suburbs;
- 24 are in the top 80 – 90 per cent of most advantaged Australian suburbs;
- 10 are in the top 70 – 80 per cent most advantaged Australian suburbs.
In fact, we only have four suburbs that are in the bottom 50 percent of disadvantaged suburbs – and an incredible one suburb, Symonston, is in the bottom 10 per cent. (Ahhhh hang on a minute, isn’t that where three caravan parks reside? Gotta love planning in Canberra.)
As for the rest of the ‘results’ (these amazingly complex statistics that only a total geek can comprehend) – behold, the top 10 advantaged suburbs in Canberra:
- Barton
- Campbell
- Chapman
- City
- Crace
- Deakin
- Fadden
- Forde
- Forrest
- Kingston
And, in reverse, the 10 most disadvantaged suburbs in Canberra are:
- Symonston
- Oaks Estate
- Charnwood
- Richardson
- Holt
- Tharwa
- Scullin
- Florey
- Isabella Plains
- Page
Some of these results may raise a few eyebrows in Canberra, especially those living in the leafy suburbs of Red Hill, Yarralumla and Reid that didn’t make the top 10 most advantaged suburbs in Canberra.
I suppose, my major comment on these statistics is they seem to be stating the ‘absolute bloody obvious’. A quick look at house prices by suburb would give you a pretty similar result.
My final point is that, relative to the rest of Australia, Canberra is in the top 20 per cent of the nation when it comes to advantage with 85 per cent of suburbs in the top 20 per cent of advantaged suburbs in Australia (take a look at the map of Australia at the top of this story).
Do you agree with the statistics released recently ranking Canberra’s most advantaged and disadvantaged suburbs?