Canberra has the second lowest vacancy rate and second highest rents in the country.
The squeeze on Canberra’s rental market is continuing with the ACT’s vacancy rate falling to the second lowest in the country, and rents only surpassed by Sydney.
Data released by SQM Research this week shows a vacancy rate of 0.8 per cent in July, down from 0.9 per cent in June and 1.1 per cent a year ago. Only Hobart has a lower vacancy rate at 0.7 per cent.
Out of 72,623 properties across Canberra, there were only 687 listings.
The data also shows Canberra’s asking rents for a three-bedroom house standing at $626 a week and $437 for units, compared with Sydney, the nation’s highest, at $707 a week, although that represents a fall of 0.3 per cent over the month to 12 August. Asking unit rents in Sydney are $515, down 1.2 per cent.
Canberra’s house rents are up 11.7 per cent over the year, the highest rise in the country, although the data shows a slight 0.8 per cent rolling month fall since June. Units are up 4.3 per cent over the year and down 0.6 per cent on the monthly figure.
This comes after last month’s Domain Rental Report showed the ACT had the equal highest rents in the country on a par with Sydney, with the median weekly rent for a house in Canberra at $550, up 3.8 per cent over the three months to June. The median unit rental price was $450, the second highest in the nation behind Sydney’s $550.
Nationally, the number of vacancies Australia-wide sat at 72,458 properties. Sydney’s vacancy rate was unchanged at 2.8 per cent from June, the highest level since SQM started recording the data in 2005, and well up from 1.9 per cent a year ago with 19,114 properties available for rent.
In contrast to Sydney, Melbourne’s vacancy rate is much lower, just 1.6 per cent in July, though unchanged from June and a year ago.
Capital city asking rents for houses fell over the month to 12 August 2018 by 0.2 per cent to $548 a week. Unit asking rents dropped 0.9 per cent to $440 a week. Over the year, asking house rents rose just 0.2 per cent and unit rents rose a modest 0.5 per cent.
But Canberra’s rents are way out in front of Melbourne where landlords are asking $523 for houses and $411 for units.
Director of Independent Property Management Hannah Gill said the data was good news for landlords, with rents continuing to climb, but bad news for tenants who are struggling to find a property they can afford.
She said this had been the pattern for the past 12 months, and Independent had not seen a decrease in rents across its rent roll since September 2016.
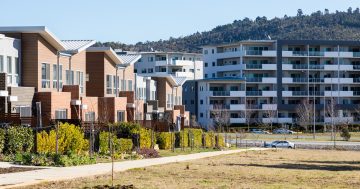
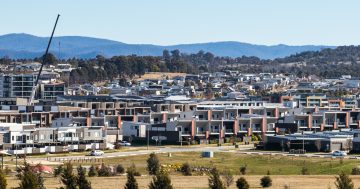
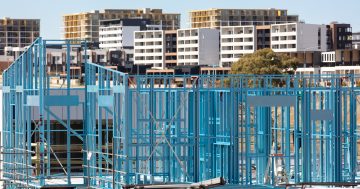
While there was a lot of apartment and unit development in Canberra, not much was market ready, and a growing population of job seekers and students was putting increasing pressure on the rental market.
“We’ve also seen in the last couple of years a decrease in the number of investors buying into developments, resulting in a smaller percentage of properties being available to tenants,” Ms Gill said.
She said that in the short-term the Government’s still-to-be-announced affordable housing strategy might alleviate the situation but longer term Canberra needed a more diverse range of housing.
“Even if we had 100 apartments hit the market that’s only going to suit a certain demographic. We need to see a range of housing available, different types of housing in different locations to meet the needs of our changing population,” she said.
“That’s not just families, but people with pets. More and more tenants want to secure properties where they can have pets and where they’re not having to hide pets at inspections, or having to give pets up, and we don’t want to see that happen,” he said.
Across Canberra’s regions, Tuggeranong has the lowest vacancy rate of 0.3 per cent down from 0.5 per cent in January, while the South has the highest at 2 per cent and was the only one to show any real increase from January when it recorded 1.4 per cent.
But the areas with the biggest number of properties such as Belconnen (0.7 per cent down to 0.5 per cent), the Inner North (1 per cent to 0.9 per cent) and Inner South (1.7 per cent to 1.4 per cent) all tightened.
Gungahlin (0.7 per cent), Weston Creek (0.6 per cent to 0.8 per cent) and Woden (1 per cent to 1.1 per cent) remained relatively steady.
The small North area tightened from 1.4 per cent in January to 1 per cent in July, but in March, out of 1137 properties there were only eight listings.
Last month, in Belconnen, out of 12,783 properties there were 64 listings. In Gungahlin there were 65 listings out of 9857 properties; the Inner North, 131 out of 13,920; Inner South, 181 out of 12,693; North, 11 out of 1147; South, 128 out of 6430; Tuggeranong, 25 out of 7677; Weston Creek, 22 out of 2780; and Woden Valley, 60 out of 5336.
Elsewhere, Brisbane is also experiencing a sustained reduction in its vacancy rate, falling to 2.9 per cent in July, down from 3.0 per cent in June and 3.6 per cent in July 2017. This follows five straight monthly declines in rental vacancies in the first half of 2018.
Boom town Hobart’s vacancy rate was steady at 0.7 per cent in July, but up from 0.5 per cent a year ago.
Adelaide’s vacancy rate fell to 1.3 per cent from 1.5 per cent, and down from 1.8 per cent a year ago.
Darwin’s vacancy rate fell to 3.4 per cent from 3.5 per cent in June, while Perth’s slipped to 4.0 per cent, and is well down from 5.2 per cent a year earlier as the oversupply of rental properties eases there.
Managing Director of SQM Research, Louis Christopher, said that asking rents had eased in Sydney given the greater supply of rental accommodation – and he expected rents to keep falling.
“The supply of rental accommodation, especially of new units, has jumped following the building boom in the city. Sydney has also experienced slowing population growth, which has helped to push asking rents lower, as landlords increasingly struggle to fill properties. In contrast, the tight rental market in Hobart is continuing to push rents higher,” he said.
