The ABS has started to release the results of the 2006 Census
Interesting facts about the ACT:
324,034 persons usually resident in Australian Capital Territory: 49.3% were males and 50.7% were females. Of the total population in Australian Capital Territory 1.2% were Indigenous persons, compared with 2.3% Indigenous persons in Australia.
19.1% of the population usually resident in Australian Capital Territory were children aged between 0-14 years, and 20.3% were persons aged 55 years and over. The median age of persons in Australian Capital Territory was 34 years, compared with 37 years for persons in Australia.
89.5% of persons usually resident in Australian Capital Territory were Australian citizens, 21.7% were born overseas and 0.9% were overseas visitors.
73.0% of persons usually resident in Australian Capital Territory stated they were born in Australia. Other common responses within Australian Capital Territory were: England 4.0%, New Zealand 1.2%, China 1.1%, India 0.8% and Viet Nam 0.7%.
English was stated as the only language spoken at home by 81.0% of persons usually resident in Australian Capital Territory. The most common languages other than English spoken at home were: Mandarin 1.1%, Italian 1.1%, Vietnamese 0.9%, Cantonese 0.9% and Greek 0.8%.
The most common responses for religious affiliation for persons usually resident in Australian Capital Territory were Catholic 28.0%, No Religion 23.4%, Anglican 16.7%, Uniting Church 4.0% and Presbyterian and Reformed 2.7%.
47.7% of persons aged 15 years and over usually resident in Australian Capital Territory were married, 37.2% never married, 10.9% separated or divorced and 4.1% widowed.
In Australian Capital Territory, the median weekly individual income for persons aged 15 years and over who were usual residents was $722, compared with $466 in Australia. The median weekly household income was $1,509, compared with $1,027 in Australia. The median weekly family income was $1,773, compared with $1,171 in Australia.
There were 84,508 families in Australian Capital Territory: 47.0% were couple families with children, 36.2% were couple families without children, 15.1% were one parent families and 1.6% were other families.
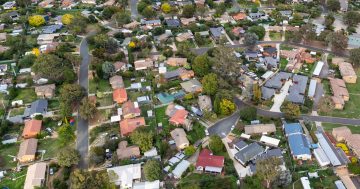
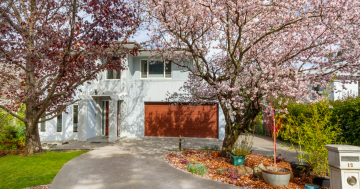
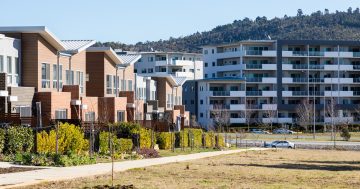
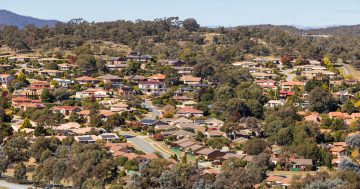
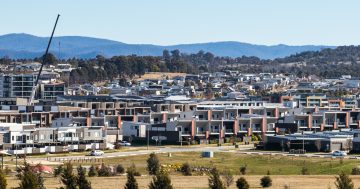
There were 122,901 occupied private dwellings counted in Australian Capital Territory: 75.0% were separate houses, 13.5% were semi-detached, row or terrace house, townhouse etc, 11.3% were flat, unit or apartment and 0.2% were other dwellings.
In Australian Capital Territory, the median weekly rent was $260, compared to $190 in Australia. The median monthly housing loan repayment was $1,500, compared to $1,300 in Australia. The average household size was 2.6 and the average number of persons per bedroom was 1.1.
In Australian Capital Territory, 28.7% of occupied private dwellings were fully owned, 36.9% were being purchased and 28.6% were rented.
In Australian Capital Territory, 67.9% of occupied private dwellings were family households, 22.1% were lone person households and 5.1% were group households.
So in summary, compared to the rest of Australia the average Canberran is more likely to:
be aged 15 to 54 years old
born in Australia
speak only English
be a Catholic or atheist
have a much higher income
have children
live in a separate or semi-detached house
be renting
pay a lot more rent
live in a group house
live in government housing
and less likely to:
be married,
own their own home
be widowed
be an indigenous person


