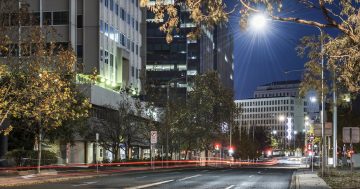
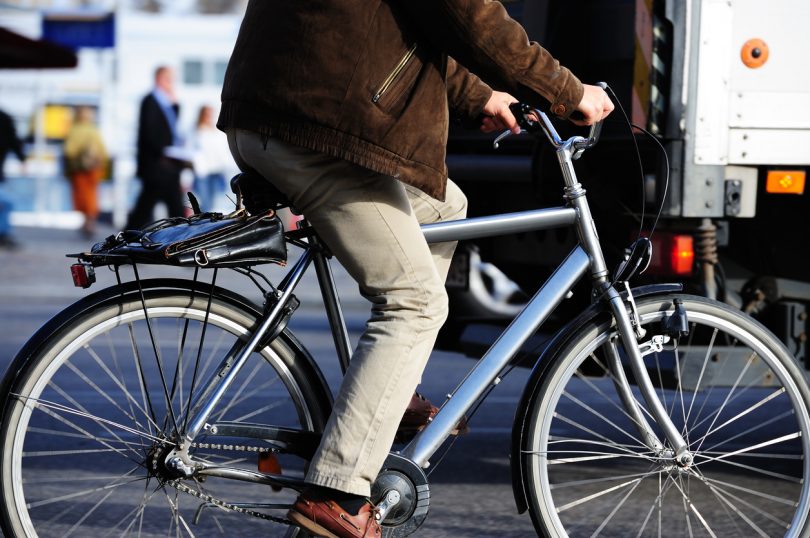
 Canberra has the highest rate of people walking or cycling to work of any Australian capital city according to the latest insights from the 2016 Census.
Working and studying in health has emerged as one of the main growth areas in the ACT according to the latest Census figures, while employment in the retail trade has dropped slightly.
Public Administration and Safety remain Canberra’s primary industry of employment, but the number of people employed in this area has dropped by one per cent since 2011 – no doubt due to public service job cuts.
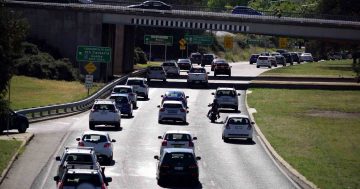
The latest figures from the 2016 Census of Population and Housing released by the Australian Bureau of Statistics (ABS) show that while cars remain the most common way for Canberrans to get to work – as is the case nationally – Canberra has the lowest percentage increase in car use at five per cent.
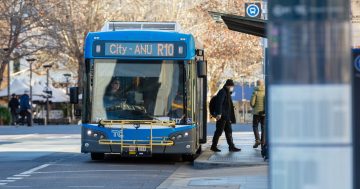
“When it came to commuting, given population increases from 2011 to 2016, the Census recorded increases in numbers for each of the four most common ways that people in the ACT travelled to work,” Census Program Manager Bindi Kindermann said.
“The Census recorded that the largest increase was for the bicycle (15 per cent) followed by walking (14 per cent) and then the bus (11 per cent). This pattern is generally in contrast to the national picture.”
The Census data shows that 8.4 per cent of Canberrans walk or cycle to work – more than double the percentage who walk or cycle to work in Perth (3.8 per cent). Low percentages of people also walk or cycle to work in Adelaide (4.0 per cent) and Brisbane (4.9 per cent) while Hobart has the next highest proportion after Canberra at 8.1 per cent.
Adelaide has the highest percentage of people driving to work (79.9 per cent) while Sydney has the highest percentage of people who catch a train, bus, tram or ferry to work (20.9 per cent). Canberra’s percentages in these two areas are 74.9 per cent (the third lowest) and 7.1 per cent (also the third lowest) respectively.
More Canberrans working in health field
When it comes to developments in working and studying, the number of Canberrans who the Census recorded as having qualifications in the health field increased by 27 per cent between 2011 and 2016.
The number of people employed in the ACT’s Health Care and Social Assistance industry grew by 18.8 per cent between 2011 and 2016 to become the second largest employing industry for the ACT in the Census, while Retail Trade fell by 1.6 per cent.
Community and Personal Service Workers – which includes carers, hospitality workers and protective service workers – was the ACT occupation with the largest growth in the Census between 2011 and 2016, increasing by 19 per cent.
The ACT’s most popular field of study is Society and Culture, which includes Political Science, Law and Economics. The Census revealed that 43,000 people hold a qualification in one of these areas.
Out of the Territory’s population on Census night 2016, 17,300 people had moved from interstate within the preceding 12 months while 9,400 had moved from overseas during that time.
More information on the ACT in the 2016 Census can be found at the ACT QuickStats page and the Canberra QuickStats page.
Interesting national insights
Across Australia, the Community and Personal Service Workers occupation group saw the biggest increase (19 per cent) between the 2011 Census and last year’s.
The Census data showed there are still noticeable gender differences in Australian occupations – with 84 per cent of technicians and trades workers being male, while 74 percent of health professionals and 63 per cent of legal, social and welfare professionals are female.
Census data also showed some interesting insights into the ages of certain occupations. People under the age of 30 are more likely than older age groups to be fast food cooks, waiters, sportspeople, bar attendants and baristas.
 By contrast, people aged over 60 are more likely than younger age groups to be livestock and mixed crop farmers, caretakers, and bus/coach drivers.
Data from the 2016 Census is now available on the ABS website, www.abs.gov.au/census
Method of travel to work – by Greater Capital City1
| Car, as driver (%) | Train, bus, tram or ferry (%) | Bicycle or walked only (%) | |
| Sydney | 65.5% | 20.9% | 5.9% |
| Melbourne | 74.4% | 13.4% | 5.4% |
| Brisbane | 75.3% | 10.5% | 4.9% |
| Adelaide | 79.9% | 8.3% | 4.0% |
| Perth | 79.3% | 8.1% | 3.8% |
| Hobart | 76.0% | 5.3% | 8.1% |
| Darwin | 75.2% | 6.8% | 7.1% |
| Canberra | 74.9% | 7.1% | 8.4% |
1 – Single method of travel only. Excludes “Worked from home”, “Not stated”, “Did not go to work” and all multi-response categories
Do you walk or cycle to work? Do you think more Canberrans should do the same? Let us know your thoughts in the comments below.