Results of the national plebiscite on same-sex marriage. Image courtesy Australian Bureau of Statistics.
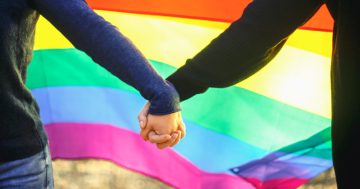
Australians have voted ‘yes’ on same-sex marriage in the survey ‘Should the law be changed to allow same-sex couples to marry?’ with a national tally of 61.6 percent voting Yes and 38.4% voting No. An overwhelming majority of the 79.5% of Australians responded to the same-sex marriage survey.
However, the great news for Canberrans is that 82.4% of our eligible population voted in the survey, the highest response rate in the nation. Of these respondents 74% voted ‘yes’ and 26% voted ‘no’. This is the highest ‘yes’ vote of any state or territory.
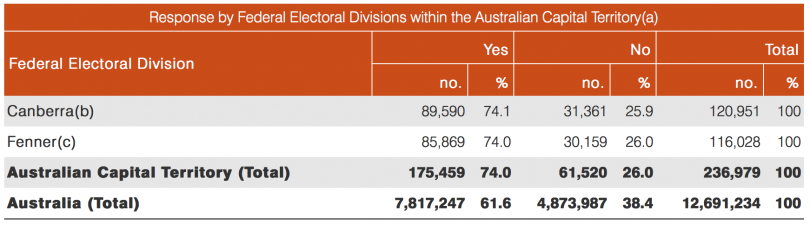
ACT statistics of the same-sex marriage survey. Image courtesy Australian Bureau of Statistics.
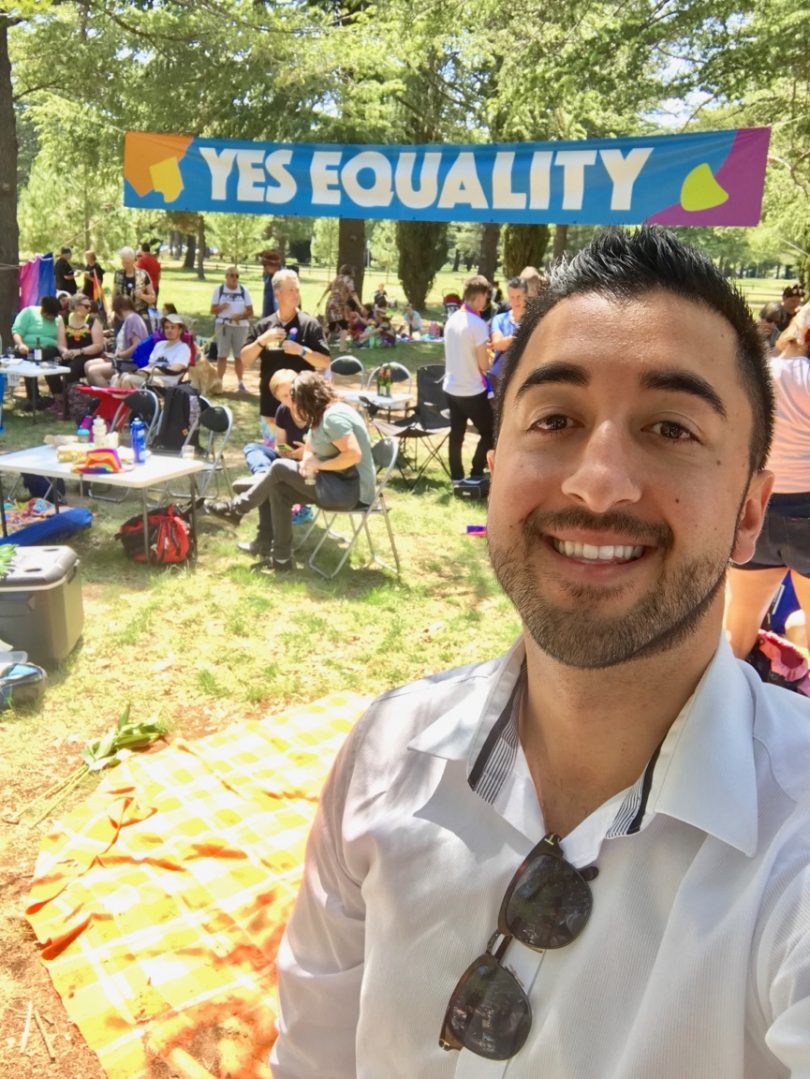
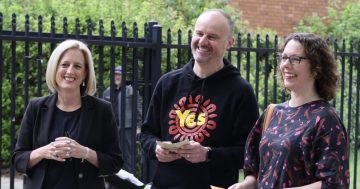
Prominent Canberra businessman Jason Roses at Haig Park when the results were announced.
237,513 (82.4%) eligible Australians in the ACT participated in the Australian Marriage Law Postal Survey.
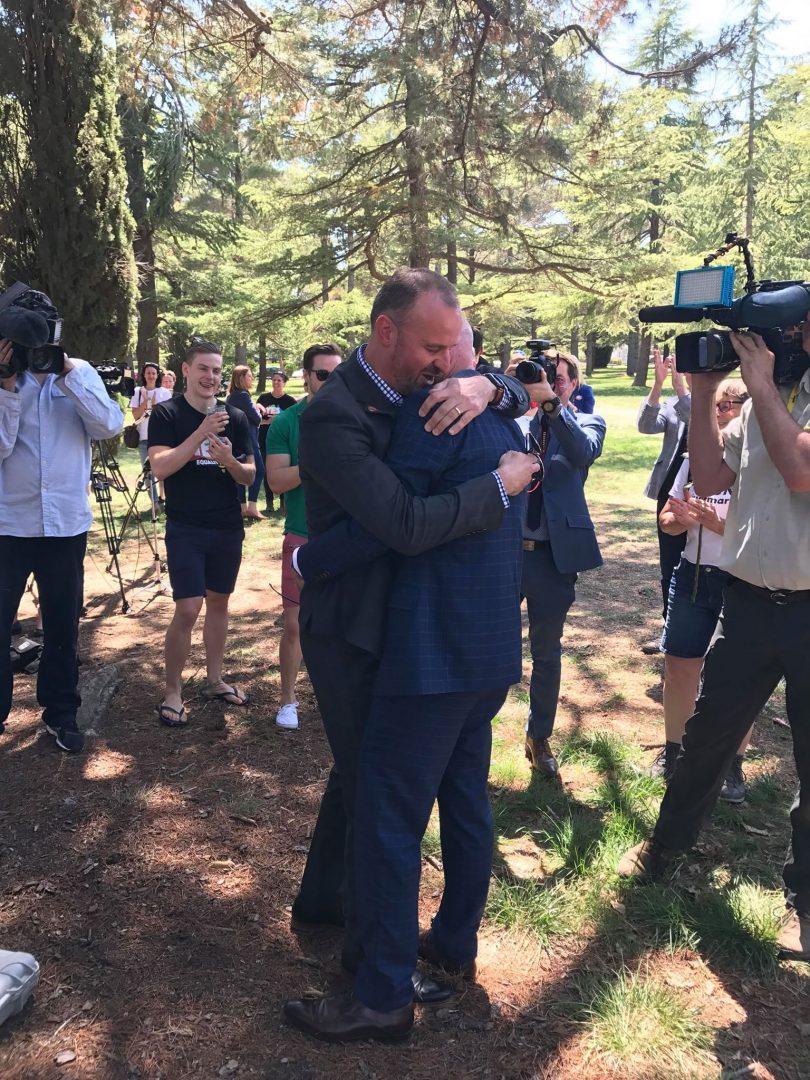
An emotional moment as Chief Minister Andrew Barr is embraced at Haig Park after the results were announced. Image courtesy Jason Roses.
Females responded more than males. In the ACT, 84.6% (123,738) of eligible females and 80.1% (110,992) of eligible males responded to the survey.
In the ACT, those aged 70 to 74 were the most likely to respond to the survey with 90.9% of eligible Australians in this age group participating. The participation rate was lowest in those aged 20 to 24 at 77.5%.
Nationally:
Of the eligible Australians who expressed a view on this question, the majority indicated that the law should be changed to allow same-sex couples to marry, with 7,817,247 (61.6%) responding Yes and 4,873,987 (38.4%) responding No. Nearly 8 out of 10 eligible Australians (79.5%) expressed their view.
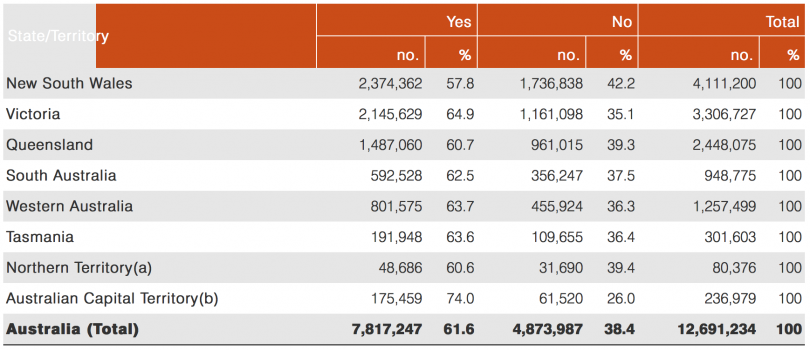
National results of the same-sex marriage survey. Image courtesy Australian Bureau of Statistics.
All states and territories recorded a majority Yes response. 133 of the 150 Federal Electoral Divisions recorded a majority Yes response, and 17 of the 150 Federal Electoral Divisions recorded a majority No response.
12,727,920 (79.5%) eligible Australians participated in the Australian Marriage Law Postal Survey.
Females were more likely to participate than males. Nationally, 81.6% (6,644,192) of eligible females and 77.3% (5,980,168) of eligible males participated in the survey.
Those aged 70 to 74 were the most likely to respond to the survey, with 89.6% of eligible Australians in this age group participating. The participation rate was lowest in those aged 25 to 29 at 71.9%. The youngest age group of eligible Australians (those aged 18-19 years) were more likely (78.2%) to participate than any other age group under the age of 45 years.
For a full breakdown of the results, visit the Australian Bureau of Statistics website.
What are your thoughts on the Same-Sex marriage survey results? Let us know by commenting below.