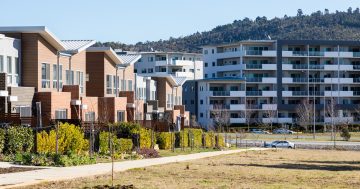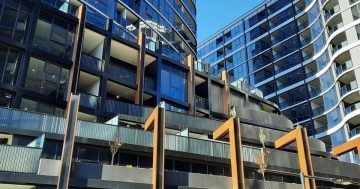
Home ownership in the ACT appears to be in retreat. Photo: George Tsotsos.
Canberrans are renting more than ever as the rate of home ownership in the ACT continues to fall in the face of an increasing disconnect between incomes and soaring property prices and the Territory’s changing demographic profile.
The Australian Bureau of Statistics report, titled Housing Occupancy and Costs, 2017-18, shows that the percentage of Canberrans who own their own home, either outright or with a mortgage, has plummeted since the turn of the century, falling nearly 12 per cent to 63.8 per cent.
In 2000-01 before the housing boom, 75.3 per cent were home owners but only eight years later, that figure had dropped to 70.8 per cent, and by 2015-16 it fell further to 67.1.
Over the 20-year period, the fall is not so great at just 3 per cent (66.8 per cent in 1997-98), but it appears the surge in home ownership on the way to the new century is not going to be repeated unless incomes increase or prices fall, despite Canberrans having the highest incomes on average in the country.
The median value of dwellings in the ACT is $625,000, while the mean gross household income per week (in 2017-18 dollars) is $2687. Twenty years ago that was $251,000 and $1755.
In 2017-18, 40 per cent of Canberrans owned their home with a mortgage, and 25 per cent without, compared with 31.6 per cent and 36.2 per cent 20 years ago.
The number of renters has risen to 34.1 per cent in 2017-18, up from 2015-16 when they comprised 31.7 per cent. It’s been a steady increase since the turn of the century, when it was 23.3 per cent, and in 2007-08, 28.3 per cent.
Two decades ago 31.9 per cent of Canberrans were renters but many were able to make the leap into their own homes in the late 1990s.
The other factors to take into account is the surge in student numbers, particularly from overseas, and the increase in migration.
Housing costs as a proportion of gross household income have fluctuated over the years but in 2017-18 home owners without a mortgage paid $68 a week on average; owners with a mortgage paid $479 per week, or 14 per cent of gross weekly household income; and all renters paid $382 per week, or 18 per cent of gross weekly household income.
But renters in the private market paid on average $444 a week, while back in 1997-8 it was $289. Things have improved, with weekly rents as high as $510 in 2012.
The percentage of people paying 25 per cent or less of their income was 78.5 per cent, more than 25-30 per cent 7.4, and more than 30-50 per cent 9.7, which is the highest figure in the housing stress range since 1994-95 apart from a peak of 12 per cent in 2007-08.
The median mortgage outstanding in the ACT was $282,000.
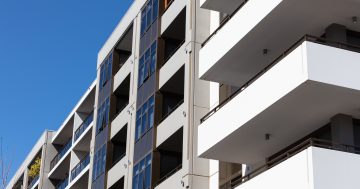
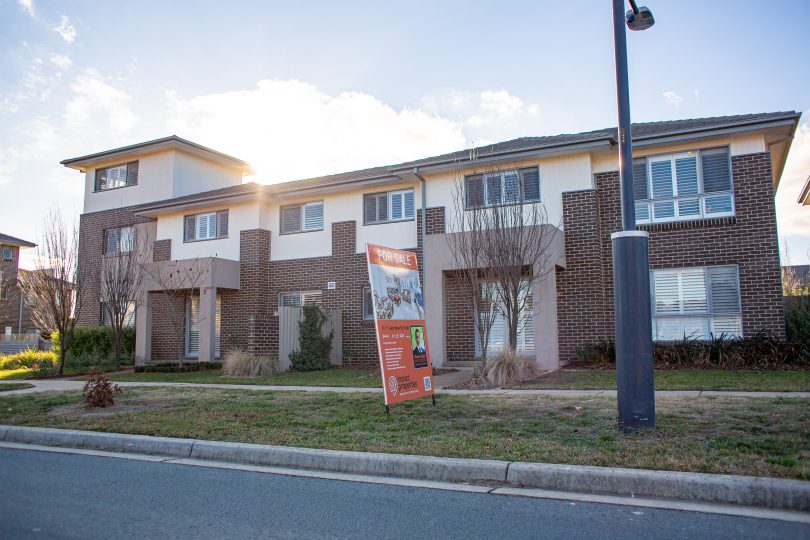
The rate of detached homes in the ACT has also fallen from 82.2 per cent in 1997-98 to 68.7 per cent in 2017-18. As to be expected, apartments now comprise a much bigger piece of the housing pie at 13.2 per cent, up from only 6.3 per cent 20 years ago.
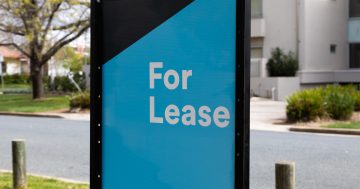
The housing data comes as new figures show a better environment for renters with an improvement in the ACT’s vacancy rate over the past year to June and falls in house rents but a rebound in what you will pay for an apartment.
According to SQM Research, the vacancy rate rose 1.3 per cent, up from 1.2 per cent in May and 0.9 per cent a year ago. Renters now have greater options with 847 vacancies compared with 785 in May and only 565 in June 2018.
House rents were $624, up slightly by 0.9 per cent on May but down 1.1 per cent over the year, but units were up 5 per cent over the year to $461.